
When it is mid-afternoon, you may want to take some snacks. We want our snack to be healthy. What foods should we include? What foods would be best avoided? Look for information and create an image (infography), which gives advice on how to snack in a healthy way.
Health Patrol: Mission 2
A healthy snack
Research
Look for information on the Web about healthy snacks and unhealthy snacks. You can start by openinig this video on YouTube in which nutritionist dietitians Jéssica Hierro and Adriana Oroz tell us which snacks are not recommended and how we can choose to prepare simple snacks, in which sugar is not the protagonist.
You can find more recommendations on healthy snacks on the website of Pharma 2.0 . On this page, a team of pharmacists talk about healthy snacks for boys and girls, and give a few very interesting ideas.
Activity
To summarize what you have seen, you can take note, in two columns, of the snacks of which they speak. In one column you will note those that do not recommend and in the other the healthy snacks.
With all the information you have collected, you will have to create an infographic.
What is an infographic and how is it made?
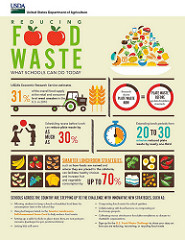
Infographics combine images and texts to visually represent information, data or concepts, in a fast and clear way. The Net is full of infographics. You can search with your browser the term "infographics", you will see how a lot of results appear.
Tools to create an infographic:
- Offline solutions: through applications installed on our computers, without needing to be connected to the Internet, such as free programs Inkscape or LibreOffice Impress.
- Online solutions: various services on the Internet facilitate the creation of infographics. It is usually necessary to register and create a user account. Some of the best known services, with free version, are: Canva, Piktochart and Easel.ly (in all three you can sign up using your Google account).
On the Net you will find a lot of information to find the right tools with which to develop infographics. For example, on this page, which informs you of ten tools to create them.
You do not have to do a complicated job. A few texts and a few images, well distributed, can be more effective than a very overloaded design and with an excess of information. In the following image you have an example of a simple infographic made with Inkscape, using free-use images found in Pixabay.
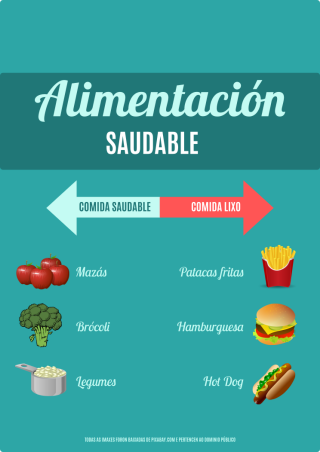
. Infografía sobre alimentación saludable (CC BY-SA)
You can open here the image with greater resolution: access to the image.
Task
Team members create an infographic about proper and unsuitable foods for a healthy snack.
The infographics will be digital, preferably, although it can also be replaced by a physical poster, made with traditional techniques.
Once the work is finished, you will have to share them with the rest of your classmates and with the teacher, publishing them in a class blog and / or uploading them to a repository that everyone can access.
Assessment of the task
To evaluate the task, the following rubrics will be used:
- Rubric for the teacher (pdf - 49.91 KB).
- Rubric for students: Self-assessment (pdf - 49.81 KB).
- Rubric for students: Peer assessment (pdf - 48.90 KB).
Look at them carefully before starting work and check at the end if you fulfill the requirements contained therein.
Learning Journal
Write a new entry in your Journal now. Tell your experience making the infographics.
Obra publicada con Licencia Creative Commons Reconocimiento Compartir igual 4.0